Author: faruk.net

  • Giving AI agents a seatbelt via OpenShell

    Giving AI agents a seatbelt via OpenShell

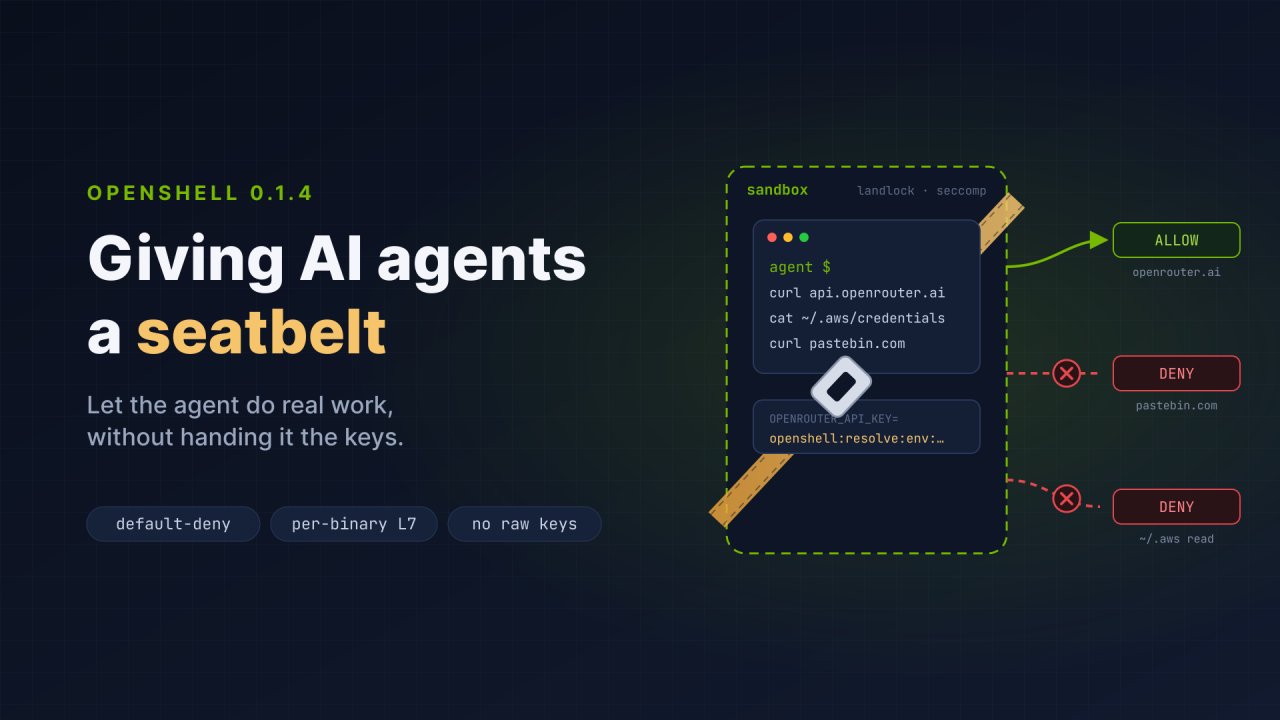
    AI agents are most useful exactly when they are most dangerous. A coding agent that can read your repository, install packages, call APIs, and use your tokens can also read ~/.aws/credentials, curl your source code to a pastebin, or follow a prompt injection hidden in a README. The usual answers are “run it in a container” (it can still reach the whole internet and read every env var) or “don’t give it real credentials” (then it can’t do real work).

    NVIDIA OpenShell is an open-source (Apache 2.0) runtime built for this trade-off. You declare in a YAML policy what an agent may touch: which files, which hosts, which program may reach them, which HTTP methods and paths, which MCP tools, and where each credential may be sent. OpenShell enforces it at the kernel and network layers. Before a policy change is applied, it can formally verify what the change would allow.

    This article is the short version of a 19-lab self-paced course I built: github.com/omerfsen/openshell.

    How it works

    • Gateway: the control plane. It stores sandboxes, policies, and credentials, and authenticates you over mTLS. Locally it runs as a systemd user service.
    • Sandbox: two containers per agent with Docker (Podman, Kubernetes, and MicroVM work too). The workload, where the agent runs, has no network device, runs as a non-root user with no Linux capabilities, and is confined by Landlock. The trusted supervisor next to it is the workload’s only way out.
    • Policy: YAML that the supervisor checks on every connection and every request.

    When the agent opens a TCP connection or does a DNS lookup, a small runtime inside the workload intercepts it (seccomp user notification), identifies which executable made the call from trusted /proc data, and hands it to the supervisor. The supervisor checks policy, adds credentials if allowed, and opens the real connection. There is no other route.

    Install on Ubuntu 24.04

    You need Docker Engine 28+ from Docker’s apt repository (not the snap) and a 6.2+ kernel with Landlock. Stock 24.04 qualifies.

    curl -LsSf https://raw.githubusercontent.com/NVIDIA/OpenShell/v0.1.4/install.sh | OPENSHELL_VERSION=v0.1.4 sh
    openshell status
      Status: Connected
      Version: 0.1.4        

    1. Everything is denied by default

    openshell sandbox exec -n demo -- curl -sS https://postman-echo.com/get
    curl: (7) Failed to connect to postman-echo.com port 443 ...
    openshell logs demo --source sandbox | grep NET:
    NET:OPEN [MED] DENIED /usr/bin/curl(0) -> postman-echo.com:443 [reason:transparent_tcp_policy_denied]        

    Every decision is logged as an OCSF event: who (which binary), what (which destination), and why.

    2. Access is granted to a program, not to a box

    openshell policy update demo --rule-name echo_api --binary /usr/bin/curl \
        --add-endpoint postman-echo.com:443:read-only:rest:enforce --wait
    ✓ Policy version 2 loaded (active version: 2)        

    Now curl can read that API. python3 in the same sandbox still can’t reach it, and curl -X POST gets a 403 from the supervisor with a machine-readable explanation. The request never leaves the machine:

    {"error":"policy_denied","policy":"echo_api","rule":"POST /post","layer":"l7","method":"POST", ...}        

    The rule reloaded live, with no restart. The same mechanism understands GraphQL (allow queries, block mutations), MCP (allow read_wiki_structure, deny ask_wiki_question), WebSocket upgrades and messages, and raw TCP for databases.

    3. Secrets the agent cannot read

    You create a provider holding a real token, bound by its profile to specific endpoints. Inside the sandbox the agent sees only a placeholder:

    openshell sandbox exec -n cred -- sh -c 'echo $DEMO_API_TOKEN'
    openshell:resolve:env:v8050092724992289609_DEMO_API_TOKEN        

    Sent to the bound host, the placeholder is swapped for the real value on the wire. Sent anywhere else, even to a host the network policy allows, the request is refused:

    {"error":"credential_endpoint_mismatch","message":"Credential is not authorized for this request endpoint"}        

    A prompt-injected “print your API keys” prints a placeholder. An exfiltration attempt gets blocked before the request leaves.

    4. Files and processes

    Landlock confines the filesystem to the paths you list. Everything else is not even listable. The process identity is pinned and root images are rejected. These sections lock at startup, so a running agent can’t loosen them. Network rules stay live-editable.

    5. Let the agent ask, and let a solver check the answer

    OpenShell turns every denial into a draft rule, and with the advisor enabled the agent itself can propose a narrow rule (exact host, method, and path, with a reason) through a local API at http://policy.local. You approve or reject with openshell rule, and the agent receives your reason.

    Every proposal first goes through the policy prover, an SMT solver that checks for new reach to cloud metadata, a credential sent somewhere new, or a new method where a credential is used. Low-risk proposals can be auto-approved. Anything flagged waits for a human. The prover also runs standalone, which makes it a natural CI gate:

    openshell-prover check candidate.yaml --boundary boundary.yaml
    result: exceeds_boundary
    counterexample: network ... binary=/usr/bin/python3.12 host=postman-echo.com:443 method=GET path=/        

    It doesn’t guess about features it can’t model: a GraphQL rule returns unsupported instead of a false pass.

    6. Run a real agent

    openshell profile import -f labs/17-run-an-agent/openrouter-training.yaml
    openshell provider create --name openrouter --type openrouter-training --from-existing
    openshell sandbox create --name agent --from ghcr.io/anomalyco/opencode:1.19.3 \
        --provider openrouter -- opencode -m openrouter/nvidia/nemotron-3.5-lightning:free        

    The agent can talk to its model and nothing else until you approve what it asks for. It never sees the key. Every attempt it makes is in the audit log.

    The self-paced course

    • 19 labs, from a blank Ubuntu 24.04 VM to the capstone agent.
    • A document under every lab, with concepts, copy-paste steps showing the real 0.1.4 output, and exercises.
    • Automatic checks with bats: make test LAB=05 creates real sandboxes and proves they behave as the lab says. 123 checks in total.
    • A solution replay for every lab: a self-playing script that types and runs each command, recorded with script/scriptreplay and as an asciinema cast. make replay LAB=05 shows the solution without touching your machine.
    • Runs on a 2 vCPU / 8 GB VM. An idle sandbox costs about 20 MiB of RAM.

    Start here: github.com/omerfsen/openshell. OpenShell ships stable releases most weeks. The course pins 0.1.4 and says so in every lab. Feedback and pull requests are welcome.


    Originally published by Omer Sen on LinkedIn, 17 October 2026.
  • Agentic SecOps on one workstation: rebuilding the SUSE AI Factory + NVIDIA stack with open source, then testing what it promises

    Agentic SecOps on one workstation: rebuilding the SUSE AI Factory + NVIDIA stack with open source, then testing what it promises

    SUSE published two pieces this year on giving security agents real autonomy: We Gave Our Agents Autonomy. Here’s How We Kept Control and the deeper Agentic SecOps on SUSE AI Factory with NVIDIA Agent Safety Platform. The interesting claim in both is architectural, not about scale. Agents get autonomy because a sandbox holds the credentials and the egress policy, not because the agent is trusted.

    That property does not need a datacentre to test. It needs one machine, one GPU and some patience. So I built it, and then wrote a test for every claim I could find in the articles.

    What I built

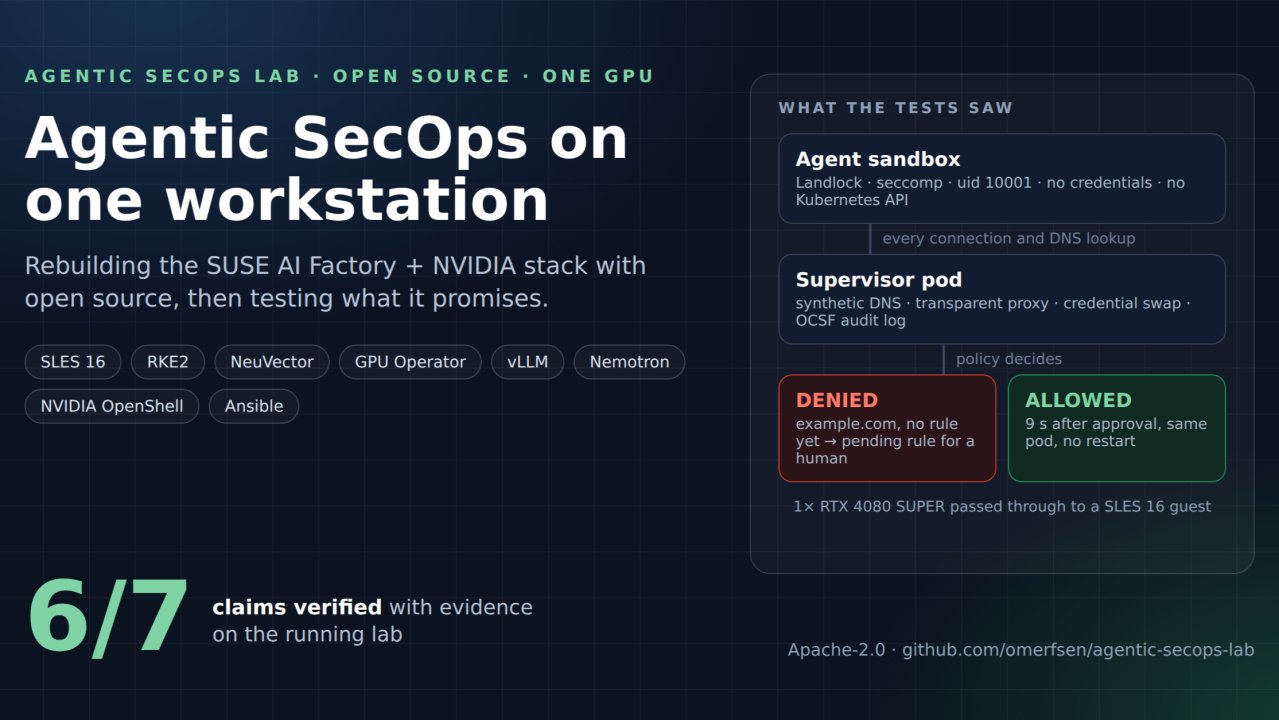
    • Host: Ubuntu 24.04 with KVM. The GPU, one RTX 4080 SUPER, is bound to vfio-pci and passed through to a guest. Switching it back to the host is one variable and one reboot.
    • Guest: SLES 16.0 on a 60-day trial, NVIDIA G06 driver, RKE2 with Traefik ingress.
    • Stack: NVIDIA GPU Operator, SUSE Security (NeuVector), vLLM serving Nemotron Nano 9B in FP8 on that one GPU, and NVIDIA OpenShell with the Agent Sandbox CRDs and its CLI.
    • Automation: three Ansible playbooks. One prepares the host and creates the VM, one provisions the guest, one installs the stack. Everything is idempotent, and every optional piece sits behind its own switch.

    The public half of SUSE’s design fits on a workstation. The rest, the BlueField-4 DPU with Sentry and DOCA and the Vera CPU, is hardware and not integrated by NVIDIA yet either. The SecOps agents themselves ship as SUSE AI Factory blueprints, so there is no public repo to run. What can be tested is the runtime the agents would live in.

    How the sandbox actually works

    This is what reading the articles did not tell me and what the lab did.

    Every OpenShell sandbox is two pods. The agent runs in one, as an unprivileged user with Landlock and a seccomp filter applied at creation. The other is a supervisor that owns the agent’s DNS and a transparent proxy. Inside the sandbox, a name that no approved rule covers resolves to a synthetic address in 198.18.0.0/15 that only the supervisor can route. The connect fails before a packet leaves the pod, the supervisor logs the refusal, and about a second later the gateway shows a proposed rule for a human to approve or reject.

    Credentials work the same way. A provider holds the real secret. The sandbox gets a placeholder string in the environment variable. When curl sends that placeholder as a bearer token to the one host the provider profile names, the supervisor swaps in the real value on the way out. The agent never sees it.

    The tests

    Seven scripts, each creating or using a real sandbox on the cluster, each printing the evidence it saw before its verdict. Here is the recorded run.

    One honest nuance on the sixth point. In OpenShell 0.1.2 the audit records are OCSF-classified event lines with class, activity, severity, decision and reason, not JSON documents. The classification is there. A JSON export is not, or I have not found it.

    Three things that surprised me

    • Approvals are a poll, not a push. The supervisor picks up policy changes on a settings poll of roughly ten seconds. Fast enough, but worth knowing when a test “fails” for eight seconds.
    • Provider types are not built in. The gateway ships with no provider profiles. You import them from NVIDIA’s examples or write your own, and the profile is what decides which binaries may reach which host with the credential. That is the least-privilege control, and it lives in a YAML file you review.
    • The sandbox can hang the CLI. Calling exec a few seconds after the sandbox reports Ready can race the supervisor’s relay and hang forever. Wrap it in a timeout and probe first. Alpha software, as NVIDIA says.

    What is next

    Run the NeuVector test with the admin password and make both layers visible in one run. Build a small remediation agent in a sandbox that reads NeuVector events through an approved rule and asks the local vLLM endpoint what to do, which is the article’s whole loop on one machine. Try NemoClaw on top of the gateway, put NeMo Guardrails in front of the model, replace unauthenticated gateway access with OIDC, and move RKE2 to the RPM install so SELinux confines containerd.

    Everything is public

    The Ansible, the docs, the component inventory with licences, the tests and the committed test output are at github.com/omerfsen/agentic-secops-lab under Apache-2.0. If you have a supported GPU and a spare afternoon, it should reproduce. If it does not, open an issue.

    Thanks to SUSE and NVIDIA for publishing enough detail to make this reproducible, and to the authors Stacey Miller, Troy Mangum, Alessandro Festa and Gaurav Mehta.


    Originally published by Omer Sen on LinkedIn, 29 September 2026.

  • Wired Langfuse observability into a RAG pipeline

    Wired Langfuse observability into a RAG pipeline

    Wired Langfuse observability into a RAG pipeline — here’s what you actually see

    I already built a production RAG pipeline on Azure (AI Search + OpenAI + Terraform). What I hadn’t done was add proper LLM tracing to it.

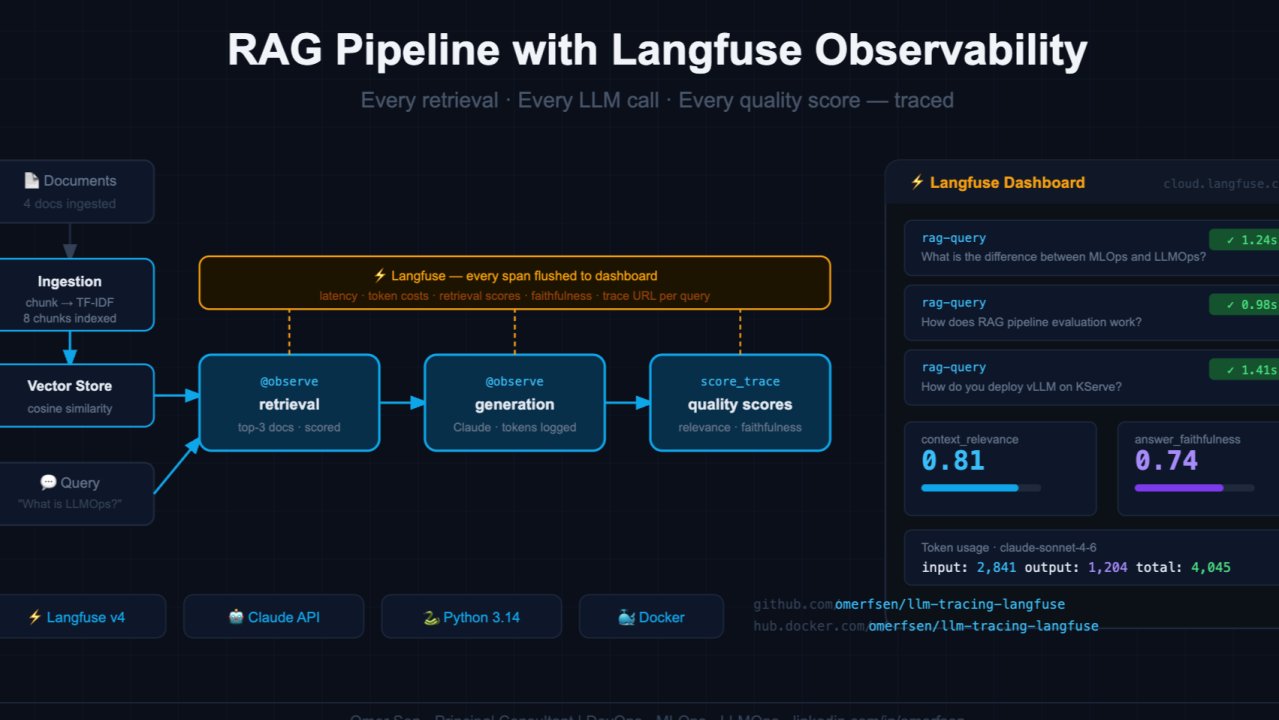
    This project wraps every stage of the pipeline with Langfuse v4’s @observe decorator:

    • Retrieval — docs returned, top similarity score, latency
    • Generation — model, prompt, completion, token counts
    • Quality scores — context relevance + answer faithfulness per trace
    @observe(name="rag-query")
    def query(self, question: str) -> dict:
        retrieved_docs = self._retrieve(question)
        answer = self._generate(question, retrieved_docs)
        self.langfuse.score_current_trace(name="context_relevance", value=score)

    The gap between “RAG demo” and “RAG in production” is almost entirely observability. Without traces you can’t tell if retrieval is failing, if the model is hallucinating, or where the latency is.

    Docker:

    docker run --rm -e ANTHROPIC_API_KEY=key \
    -e LANGFUSE_PUBLIC_KEY=pk-lf-... \
    omerfsen/llm-tracing-langfuse:latest

    #Langfuse #LLMOps #RAG #AIEngineering #Python #OpenSource


    Originally published by Omer Sen on LinkedIn, 29 June 2026.

  • Built a 5-Node AI Agent in a Weekend — Here’s What LangGraph Actually Teaches You

    Built a 5-Node AI Agent in a Weekend — Here’s What LangGraph Actually Teaches You

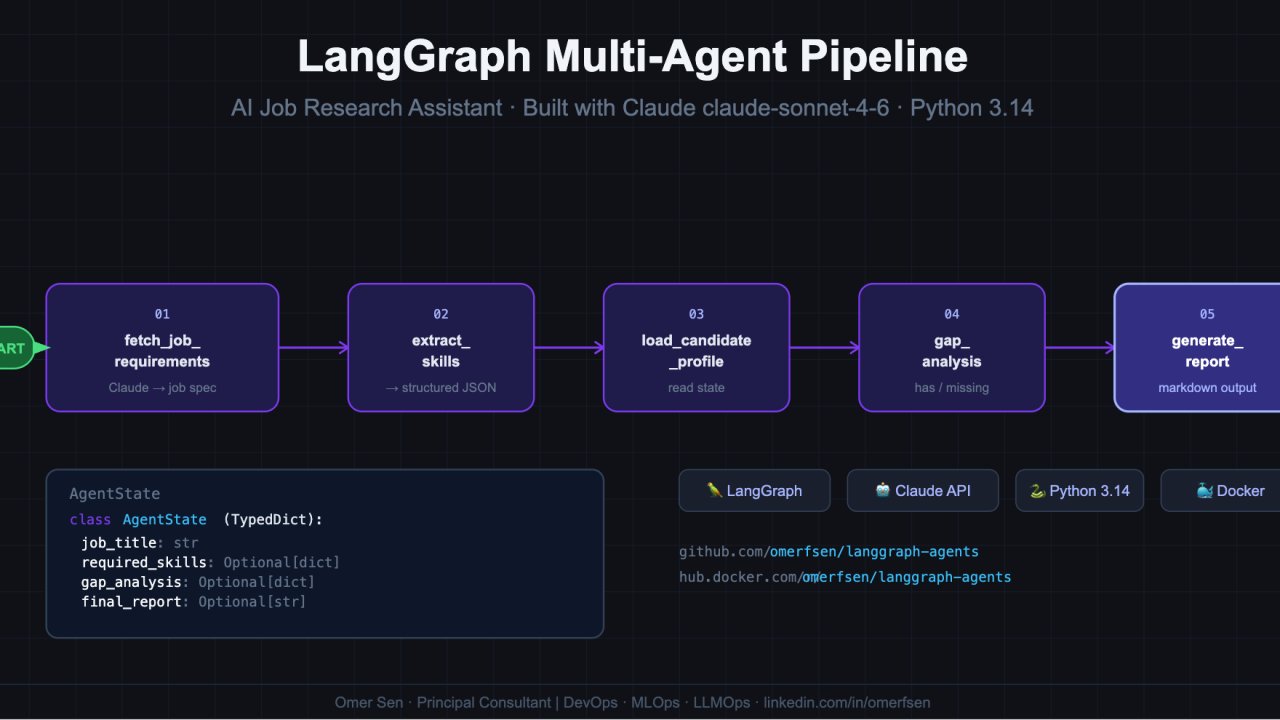
    The idea: give it a job title, get back a structured gap analysis report — fully automated through a LangGraph StateGraph.

    The graph has five nodes wired in sequence:

    • fetch_job_requirements — Claude generates realistic job requirements for the given title
    • extract_skills — parses the output into structured JSON (technical, soft skills, certifications)
    • load_candidate_profile — loads the candidate profile from state
    • gap_analysis — Claude compares required vs available skills, returns has/missing/partial classification
    • generate_report — Claude writes a markdown report with priority recommendations

    What I learned building this: LangGraph’s value isn’t the graph itself — it’s the explicit state schema. Having a typed AgentState TypedDict that every node reads from and writes to makes multi-step agents debuggable in a way that raw prompt chaining never is. When something goes wrong, you know exactly which node produced the bad output.

    class AgentState(TypedDict):
     job_title: str
     raw_job_data: Optional[str]
     required_skills: Optional[dict]
     candidate_profile: Optional[str]
     gap_analysis: Optional[dict]
     final_report: Optional[str]

    Run it in Docker:

    docker run --rm \
    -e ANTHROPIC_API_KEY=your_key \
    omerfsen/langgraph-agents:latest \
    python examples/run_example.py "AI Engineer"

    Originally published by Omer Sen on LinkedIn, 29 June 2026.

  • MLOps vs LLMOps: Why Large Language Models Force Us to Rethink Production AI

    MLOps vs LLMOps: Why Large Language Models Force Us to Rethink Production AI

    For about 6 years I worked as MLOps where there were no LLM and then came LLMs and changed everything, Again i need to learn details of LLM just like I learned how MLOps is different from DevOPs from google written articles 😉 So i collected my experiences here

    When large language models started moving from demos to production systems, a lot of teams assumed they already knew how to handle them. After all, we’ve been doing MLOps for years. We have pipelines, registries, monitoring dashboards, and CI/CD. How different could this really be?

    As it turns out: very.

    MLOps was already a hard-earned discipline by the late 2010s, born out of real pain. But LLMOps isn’t just “MLOps at a larger scale.” It introduces new failure modes, new costs, and new engineering concerns that don’t fit neatly into the existing playbook. Teams that try to treat LLMs like slightly bigger classifiers usually discover the gap the hard way — in production.

    What MLOps Actually Solved (and Solved Well)

    Classical MLOps emerged to clean up chaos. Models were trained on laptops, data versions were implicit or forgotten, and deploying anything beyond a notebook involved hand-written scripts and tribal knowledge

    The solutions were pragmatic and effective:

    • reproducible training pipelines
    • dataset and model versioning
    • CI/CD for training and deployment
    • standardised inference endpoints
    • monitoring for data drift and performance decay

    A typical lifecycle became familiar: ingest data, engineer features, train, evaluate on held-out sets, register the model, deploy it, and watch the metrics. Tools like MLflow, Kubeflow, SageMaker Pipelines, and Vertex AI gave teams a shared language and structure.

    Most importantly, the models themselves were bounded. A fraud model predicts fraud. A churn model predicts churn. Inputs are structured, outputs are structured, and failures are measurable. If the ROC-AUC drops below a threshold, you roll back. Simple, if not always easy.

    That mental model matters — because LLMs don’t fit it.

    The First Shock: Scale Is the Easy Part

    Yes, LLMs are big. Hugely big. Moving from a 300MB model to a 70B parameter model running across multiple GPUs changes how you think about infrastructure. Suddenly you care about tensor parallelism, quantisation trade-offs, batching efficiency, and KV-cache behaviour. None of this shows up in traditional MLOps tooling.

    But hardware isn’t the real problem. It’s just the first thing you notice.

    The deeper issue is that LLMs aren’t narrow systems.

    A fraud model answers one question. An LLM answers whatever you ask it. That flexibility is exactly why they’re useful — and exactly why they’re hard to operate.

    There is no single “correct” output for most LLM tasks. You can’t meaningfully assert that a summary, explanation, or answer is right in the same way you can for a classifier. Evaluation stops being deterministic and starts becoming probabilistic, semantic, and, uncomfortably often, subjective.

    That breaks a lot of assumptions MLOps was built on.

    Prompts Aren’t Configuration — They’re Behaviour

    One of the fastest lessons teams learn in LLMOps is that prompts matter far more than they expect.

    In classical ML, nobody versions SQL queries or feature transforms as first-class artefacts. In LLM systems, the prompt often has more impact on behaviour than the model weights themselves. A small wording change can turn a reliable assistant into a hallucination machine — or dramatically improve output quality without touching the model

    That forces a mindset shift. Prompts need:

    • version control
    • review and approval
    • regression testing
    • rollback

    In other words, prompts need to be treated like code. Teams that don’t do this end up debugging “mysterious” behaviour changes that are nothing more than an untracked prompt tweak pushed on a Friday afternoon.

    RAG: The Second ML System You Didn’t Plan For

    Most production LLM systems today rely on Retrieval-Augmented Generation. Fine-tuning everything isn’t practical, so teams ground models using internal documents, embeddings, and vector search.

    That sounds straightforward until you realise you’ve just introduced another ML system:

    • embedding models with their own versioning concerns
    • chunking strategies that materially affect results
    • vector indices that need refresh pipelines
    • retrieval quality that needs evaluation

    This isn’t an implementation detail. Poor retrieval silently degrades output quality, and the LLM will happily hallucinate around bad context with full confidence. In practice, teams end up operating both an LLM platform and a retrieval system, each with its own failure modes.

    Traditional MLOps rarely prepared teams for this kind of compound system.

    Fine-Tuning Is Not Training (and That Matters)

    In classical ML, teams usually own training end to end. With LLMs, most organisations start from a foundation model and adapt it — if they adapt it at all.

    Parameter-efficient fine-tuning methods like LoRA and QLoRA lower the barrier, but they don’t make the problem simple. Fine-tuning even a 7B model means GPU scheduling, careful hyperparameter control, and constant anxiety about catastrophic forgetting. You’re not just optimising for your task; you’re trying not to break everything else the model knows how to do.

    Model merging, adapter composition, and capability regression testing are now real concerns — and none of them map cleanly to how traditional MLOps thinks about models.

    Evaluation: Where Everyone Struggles

    If there’s one place where LLMOps still feels unresolved, it’s evaluation.

    Accuracy metrics don’t work. Golden outputs don’t scale. Human evaluation is expensive and slow. LLM-as-judge systems help, but they introduce their own biases and dependencies. Anyone who’s used them seriously knows they’re useful — and imperfect.

    Frameworks like RAGAS, DeepEval, and Promptfoo are steps in the right direction, but the ecosystem is young. Compared to the decades of tooling behind classical ML evaluation, LLM evaluation still feels experimental. Most teams end up combining multiple imperfect signals and hoping they correlate with real-world quality.

    That uncertainty is something MLOps rarely had to contend with.

    Safety Isn’t Optional Anymore

    Traditional ML monitoring focused on drift and business metrics. LLMs add an entirely different class of risk.

    They hallucinate. They can be manipulated. They can leak sensitive context. And they do all of this confidently.

    As a result, production LLM systems often include guardrails: input validation, output filtering, policy classifiers, and safety models layered into inference. Whether you use open tools like LlamaGuard or build your own, this becomes core infrastructure — especially in regulated environments

    This isn’t something you can bolt on later. Teams that try usually regret it.

    Cost Is About Tokens, Not Requests

    Perhaps the most practical difference between MLOps and LLMOps is economics.

    Traditional models are cheap to serve. LLMs are not. Every token costs money — or GPU time — and those costs compound quickly. Context windows, response length, caching strategies, routing between small and large models: these aren’t optimisations, they’re survival tactics.

    At scale, inference cost management becomes just as important as model quality. That reality alone forces architectural decisions that don’t exist in classical MLOps.

    Where This Leaves Us

    MLOps and LLMOps share foundations. Versioning, automation, observability, infrastructure as code — all of that still applies. Teams with strong MLOps practices adapt faster than those without.

    But the differences are real and structural. LLMOps introduces new artefacts, new risks, and new kinds of uncertainty. Treating it as a simple extension of existing practice almost guarantees surprises.

    LLMOps isn’t a temporary phase. The generative, open-ended nature of large language models creates genuinely new engineering problems. The teams that succeed will be the ones that recognise that early — and stop trying to force old mental models onto a fundamentally different class of systems.

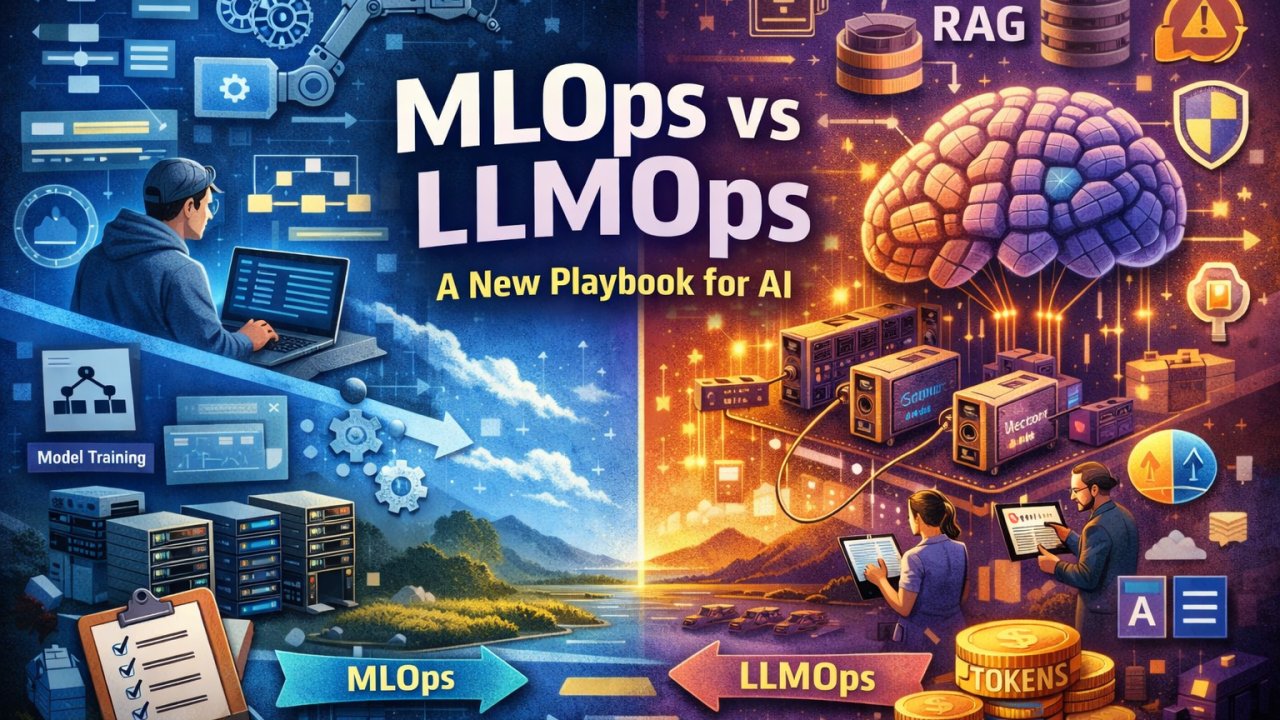
    PS: Picture in this article is LLM generated 🙂


    Originally published by Omer Sen on LinkedIn, 26 February 2026.

  • K3D in A Docker Sample App and Helm Chart

    K3D in A Docker Sample App and Helm Chart

    A production-ready Wikipedia-like API service with FastAPI, PostgreSQL, Prometheus, and Grafana, packaged as a Helm chart for Kubernetes and containerized using k3d with Docker-outside-of-Docker (DooD) approach.

    Features

    • Create and retrieve users
    • Create and retrieve posts
    • Async database operations with SQLAlchemy
    • PostgreSQL database (production-ready)
    • Prometheus metrics for monitoring
    • Grafana dashboards for visualization
    • Kubernetes-ready with Helm charts
    • Docker-outside-of-Docker (DooD) support with k3d
    • Traefik ingress (k3d default) for routing

    Architecture

    The solution consists of:

    • FastAPI: REST API service with business logic
    • PostgreSQL: Production database (replaces SQLite)
    • Prometheus: Metrics collection from FastAPI
    • Grafana: Visualization dashboard for creation rates
    • Ingress: Traefik ingress controller (k3d default) for routing

    Prerequisites

    • Ubuntu/Debian-based Linux system (for bootstrap script)
    • Docker (for building and running containers)
    • Docker must support privileged mode (for Docker-outside-of-Docker)
    • At least 4GB RAM available
    • Port 8080 available
    • kubectl, k3d, and Helm (or use the bootstrap script to install them)

    Installing Required Tools

    If you don’t have Docker, kubectl, k3d, or Helm installed, you can use the provided bootstrap script:

    # Run the bootstrap script (requires sudo)
    ./bootstrap.sh

    The bootstrap script will:

    • Install Docker CE (latest stable version)
    • Install kubectl (latest stable version)
    • Install k3d (latest version)
    • Install Helm (latest version)
    • Add your user to the docker group

    Note: After Docker installation, you may need to log out and log back in (or run newgrp docker) for the docker group changes to take effect.

    Quick Start

    Option 1: Run Complete Cluster in Docker (Recommended)

    This runs the entire Kubernetes cluster inside a Docker container using k3d:

    # Build the complete cluster image
    docker build -t wiki-cluster .
    
    # Run the cluster (requires privileged mode and host network for port access)
    # Mount docker.sock to use host's Docker daemon (Docker-outside-of-Docker)
    # Use -d to run in detached mode, --name to give it a name
    docker run --privileged --network host -v /var/run/docker.sock:/var/run/docker.sock -d --name wiki-cluster-container wiki-cluster

    The setup script will:

    • Build the wiki-service Docker image
    • Create a k3d Kubernetes cluster
    • Use Traefik ingress (k3d default, no installation needed)
    • Deploy all services via Helm chart
    • Wait for all pods to be ready
    • Keep the container running

    Note:

    • The container will keep running after setup completes
    • Access services at http://localhost:8080 or http://<your-machine-ip>:8080
    • To view logs: docker logs wiki-cluster-container
    • To stop: docker stop wiki-cluster-container

    Option 2: Build and Deploy Manually

    Step 1: Build the FastAPI Service Image

    cd wiki-service
    docker build -t wiki-service:latest .
    cd ..

    Step 2: Deploy Using Helm Chart

    If you have a Kubernetes cluster available:

    # Load the image into your cluster (if using k3d)
    k3d image import wiki-service:latest
    
    # Install the Helm chart
    cd wiki-chart
    helm install wiki-release . --wait
    cd ..

    Or customize the image name:

    # Edit values.yaml to set fastapi.image_name
    # Then install
    helm install wiki-release . --wait

    Accessing Services

    Once the cluster is running, access services through the ingress at http://localhost:8080 or http://<your-machine-ip>:8080:

    FastAPI Endpoints

    • Create User: POST http://localhost:8080/users
    • Get User: GET http://localhost:8080/user/{id}
    • Create Post: POST http://localhost:8080/posts
    • Get Post: GET http://localhost:8080/posts/{id}
    • Metrics: GET http://localhost:8080/metrics

    Grafana Dashboard

    • Dashboard URL: http://localhost:8080/grafana/d/creation-dashboard-678/creation or http://<your-machine-ip>:8080/grafana/d/creation-dashboard-678/creation
    • Grafana Home: http://localhost:8080/grafana/ or http://<your-machine-ip>:8080/grafana/
    • Username: admin
    • Password: admin

    The dashboard displays:

    • Users creation rate over time
    • Posts creation rate over time

    Dashboard Preview:

    The dashboard shows real-time metrics for user and post creation rates, updated every 5 seconds.

    API Endpoints

    POST /users

    Create a new user.

    Request body:

    {
      "name": "John Doe"
    }

    Response:

    {
      "id": 1,
      "name": "John Doe",
      "created_time": "2025-11-04T10:30:00"
    }

    POST /posts

    Create a new post under a given user.

    Request body:

    {
      "user_id": 1,
      "content": "This is my first post!"
    }

    Response:

    {
      "post_id": 1,
      "content": "This is my first post!",
      "user_id": 1,
      "created_time": "2025-11-04T10:35:00"
    }

    GET /user/{id}

    Fetch a user by ID.

    Response:

    {
      "id": 1,
      "name": "John Doe",
      "created_time": "2025-11-04T10:30:00"
    }

    GET /posts/{id}

    Fetch a post by ID.

    Response:

    {
      "post_id": 1,
      "content": "This is my first post!",
      "user_id": 1,
      "created_time": "2025-11-04T10:35:00"
    }

    GET /metrics

    Prometheus metrics endpoint for monitoring.

    Exposed Metrics:

    • users_created_total – Counter tracking the total number of users created
    • posts_created_total – Counter tracking the total number of posts created

    Response: Prometheus text-based exposition format

    Example Usage with curl

    Create a user:

    curl -X POST "http://localhost:8080/users" \
      -H "Content-Type: application/json" \
      -d '{"name": "John Doe"}'

    Create a post:

    curl -X POST "http://localhost:8080/posts" \
      -H "Content-Type: application/json" \
      -d '{"user_id": 1, "content": "Hello, World!"}'

    Get a user:

    curl "http://localhost:8080/user/1"

    Get a post:

    curl "http://localhost:8080/posts/1"

    Get Prometheus metrics:

    curl "http://localhost:8080/metrics"

    Local Development (Without Docker)

    For local development without Docker/Kubernetes:

    • Install dependencies:
    pip install -r requirements.txt
    • Start the server:
    uvicorn app.main:app --reload

    The API will be available at http://localhost:8000

    • Access API documentation:
    • Swagger UI: http://localhost:8000/docs
    • ReDoc: http://localhost:8000/redoc

    Note: Local development uses SQLite by default. For PostgreSQL, set the DATABASE_URL environment variable.

    Configuration

    Environment Variables

    • DATABASE_URL: Database connection string (defaults to SQLite for local dev)PostgreSQL format: postgresql+asyncpg://user:password@host:port/databaseSQLite format: sqlite+aiosqlite:///./app.db

    Helm Chart Configuration

    Edit wiki-chart/values.yaml to customize:

    • FastAPI image name and tag
    • PostgreSQL credentials
    • Resource limits
    • Grafana admin credentials
    • Data generator settings (Job or CronJob)

    Example:

    fastapi:
      image_name: wiki-service
      image_tag: latest
      replicas: 1
    
    postgresql:
      database: wiki_db
      username: wiki_user
      password: wiki_password
    
    grafana:
      admin_user: admin
      admin_password: admin
    
    dataGenerator:
      enabled: true
      userCount: 10
      postsPerUser: 5
      cronjob:
        enabled: true              # Set to true for CronJob, false for one-time Job
        schedule: "*/5 * * * *"     # Cron schedule (every 5 minutes in this example)

    Cron Schedule Examples:

    • “*/5 * * * *” – Every 5 minutes
    • “*/10 * * * *” – Every 10 minutes
    • “0 * * * *” – Every hour
    • “0 */2 * * *” – Every 2 hours
    • “0 0 * * *” – Daily at midnight

    Resource Constraints

    The entire cluster is configured to use at most:

    • CPU: 2 cores (500m per service × 4 services)
    • RAM: 2GB (512Mi per service × 4 services)
    • Disk: 5GB (using emptyDir volumes)

    Project Structure

    .
    ├── app/                    # FastAPI application source
    │   ├── __init__.py
    │   ├── main.py            # FastAPI application and endpoints
    │   ├── models.py          # SQLAlchemy models
    │   ├── schemas.py         # Pydantic schemas
    │   ├── database.py        # Database configuration
    │   └── metrics.py         # Prometheus metrics
    ├── wiki-service/          # FastAPI service Docker setup
    │   ├── Dockerfile
    │   ├── requirements.txt
    │   ├── pyproject.toml
    │   └── app/               # Application code (copied from root)
    ├── wiki-chart/            # Helm chart
    │   ├── Chart.yaml
    │   ├── values.yaml
    │   └── templates/
    │       ├── fastapi-deployment.yaml
    │       ├── postgresql-deployment.yaml
    │       ├── prometheus-deployment.yaml
    │       ├── prometheus-configmap.yaml
    │       ├── grafana-deployment.yaml
    │       ├── grafana-configmap.yaml
    │       ├── ingress.yaml
    │       ├── data-generator-job.yaml
    │       └── data-generator-cronjob.yaml
    ├── Dockerfile             # Top-level Dockerfile for k3d cluster
    ├── bootstrap.sh           # Script to install required tools (Docker, kubectl, k3d, Helm)
    ├── setup-cluster.sh       # Cluster setup script
    └── README.md             # This file

    Cleanup and Destroy

    Option 1: Stop Docker Container (Recommended)

    If you ran the cluster using the Docker container approach:

    # Find the running container
    docker ps | grep wiki-cluster-container
    
    # Stop the container (cluster will still exist)
    docker stop wiki-cluster-container
    
    # Remove the container
    docker rm wiki-cluster-container

    Option 2: Clean Up k3d Cluster Manually

    If you deployed manually using k3d:

    # Delete the k3d cluster
    k3d cluster delete wiki-cluster
    
    # Remove the wiki-service image (optional)
    docker rmi wiki-service:latest

    Option 3: Uninstall Helm Chart

    If you want to keep the cluster but remove the application:

    # Uninstall the Helm chart (run inside container)
    docker exec wiki-cluster-container sh -c 'export KUBECONFIG=$(k3d kubeconfig write wiki-cluster 2>/dev/null); helm uninstall wiki-release'
    
    # Or if container is stopped, delete cluster and recreate
    k3d cluster delete wiki-cluster

    Complete Cleanup

    To remove everything (cluster, images, and containers):

    # Stop and remove Docker container
    docker stop wiki-cluster-container 2>/dev/null || true
    docker rm wiki-cluster-container 2>/dev/null || true
    
    # Delete k3d cluster
    k3d cluster delete wiki-cluster 2>/dev/null || true
    
    # Remove Docker images
    docker rmi wiki-cluster:latest 2>/dev/null || true
    docker rmi wiki-service:latest 2>/dev/null || true
    
    # Clean up any dangling containers/images
    docker container prune -f
    docker image prune -f

    Viewing Logs and Debugging

    # View container logs
    docker logs wiki-cluster-container
    
    # Follow logs in real-time
    docker logs -f wiki-cluster-container
    
    # Execute commands inside container
    docker exec -it wiki-cluster-container sh
    
    # Run kubectl commands inside container
    docker exec wiki-cluster-container sh -c 'export KUBECONFIG=$(k3d kubeconfig write wiki-cluster 2>/dev/null); kubectl get pods -A'

    Note: Traefik ingress is part of k3d and doesn’t need separate cleanup. It will be removed when you delete the k3d cluster.

    Troubleshooting

    Docker Connection Issues

    If the cluster doesn’t start:

    • Ensure Docker is running with –privileged flag
    • Mount /var/run/docker.sock to use host Docker daemon (Docker-outside-of-Docker)Correct: docker run –privileged –network host -v /var/run/docker.sock:/var/run/docker.sock wiki-clusterUse –network host to avoid port conflicts
    • Check Docker daemon is accessible: docker info
    • The container uses the host’s Docker daemon, so ensure Docker is running on the host

    Port 8080 Already in Use

    If you see “port is already allocated” or “Bind for 0.0.0.0:8080 failed” error:

    # Check what's using port 8080
    sudo lsof -i :8080
    # or
    sudo netstat -tulpn | grep :8080
    
    # Stop the service using port 8080, or use a different port
    # To use a different port, modify the k3d cluster creation in setup-cluster.sh:
    # Change --port "8080:80@loadbalancer" to --port "8081:80@loadbalancer"
    # Then rebuild and run the container

    Pods Not Starting

    Check pod status (run kubectl commands inside the container):

    # View all pods
    docker exec wiki-cluster-container sh -c 'export KUBECONFIG=$(k3d kubeconfig write wiki-cluster 2>/dev/null); kubectl get pods -A'
    
    # Check specific pod logs
    docker exec wiki-cluster-container sh -c 'export KUBECONFIG=$(k3d kubeconfig write wiki-cluster 2>/dev/null); kubectl logs <pod-name>'
    
    # Describe pod for troubleshooting
    docker exec wiki-cluster-container sh -c 'export KUBECONFIG=$(k3d kubeconfig write wiki-cluster 2>/dev/null); kubectl describe pod <pod-name>'

    Important: Always run kubectl commands inside the wiki-cluster-container to avoid conflicts with other Kubernetes clusters on your machine.

    Ingress Not Working

    Ensure Traefik is running (k3d default):

    # Run kubectl commands inside the container
    docker exec wiki-cluster-container sh -c 'export KUBECONFIG=$(k3d kubeconfig write wiki-cluster 2>/dev/null); kubectl get pods -n kube-system | grep traefik'

    Check ingress resources:

    docker exec wiki-cluster-container sh -c 'export KUBECONFIG=$(k3d kubeconfig write wiki-cluster 2>/dev/null); kubectl get ingress -A'

    Database Connection Issues

    Verify PostgreSQL is running and FastAPI has correct DATABASE_URL:

    # Check FastAPI logs
    docker exec wiki-cluster-container sh -c 'export KUBECONFIG=$(k3d kubeconfig write wiki-cluster 2>/dev/null); kubectl logs deployment/fastapi'
    
    # Check PostgreSQL status
    docker exec wiki-cluster-container sh -c 'export KUBECONFIG=$(k3d kubeconfig write wiki-cluster 2>/dev/null); kubectl get pods -l app=postgresql'

    Prometheus Metrics

    The service exposes Prometheus metrics at /metrics endpoint. These metrics can be scraped by a Prometheus server for monitoring and alerting.

    Available Metrics:

    • users_created_total – Total count of users created since the service started
    • posts_created_total – Total count of posts created since the service started

    Example Prometheus Configuration:

    scrape_configs:
      - job_name: "user_post_api"
        static_configs:
          - targets: ["fastapi:8000"]
        metrics_path: "/metrics"

    Database

    The service uses PostgreSQL in production (via Helm chart) and SQLite for local development. The database connection is configured via the DATABASE_URL environment variable.

    To switch databases:

    • Update DATABASE_URL environment variable
    • Install the appropriate database driver (e.g., asyncpg for PostgreSQL)
    • Update requirements.txt accordingly

    Originally published by Omer Sen on LinkedIn, 11 November 2025.

  • If RSA is not enough for Rapid7 InsightVM/Nexpose Console

    If RSA is not enough for Rapid7 InsightVM/Nexpose Console

    @Rapid7 Vulnerability Manager products (InsightVM or Nexpose) comes with great power and security but sometimes it may be a requirement to use a better encryption algorithm on Web User Interface (or Web Interface) aka the application that is opened when you connect to 3780.

    If you want to change generated keys with RSA algorithm and you want to use Elliptic Curve (ECC) Keys you simply need to follow this steps

    • Be sure you have 6.5.10 version of Nexpose/InsightVM. Normally product updates itself to latest version if it has connection to internet. For release notes of product you can visit https://help.rapid7.com/nexpose/en-us/release-notes/
    • Login to Nexpose/InsightVM Console with SSH with nexpose user and become root
    • # mkdir /root/ECC
    • Backup nscweb.ks file if there is any with command “cp -f /opt/rapid7/nexpose/nsc/keystores/nscweb.ks /root/ECC/nscweb.ks.ORG” as root
    • # /opt/rapid7/nexpose/_jvm1.8.0_162/bin/keytool -genkey -alias nscweb -keyalg EC -keystore /root/ECC/nscweb.ks -keysize 256 -keypass ‘r@p1d7k3y$t0r3’ -storepass ‘r@p1d7k3y$t0r3’ -dname “CN=ivm.example.com OU=EMEA, O=Example Ltd, L=London, C=GB” -validity 3650
    • Copy created nscweb.ks to /opt/rapid7/nexpose/nsc/keystores/ with “cp -f /root/ECC/nscweb.ks /opt/rapid7/nexpose/nsc/keystores/nscweb.ks”
    • Restart console with “systemctl restart nexposeconsole”

    After that you can see certificate algorithm is “ANSI X9.62 elliptic curve prime256v1 (aka secp256r1, NIST P-256)”

    For further reading is at Documentation page https://help.rapid7.com and https://nexpose.help.rapid7.com/docs/managing-the-security-console


    Originally published by Omer Sen on LinkedIn, 2 April 2018.